Reports & dashboard
How to read evaluation results, where to track trends, and how to export reports for auditing.
General dashboard
The Dashboard is the entry view after login. It summarizes what's happening in your organization:
- Recent runs with status and overall score.
- Quality trend over time (the last N runs).
- Recent evaluations with pass-rate summary.
Plan usage (tokens consumed, AI generations, etc.) and plan management live in Billing & Plan — see Plans & pricing → Billing & Plan.
Evaluation Report (per Run)
Each evaluated Run produces an Evaluation Report. Go to Execution → Evaluations and click on the run.
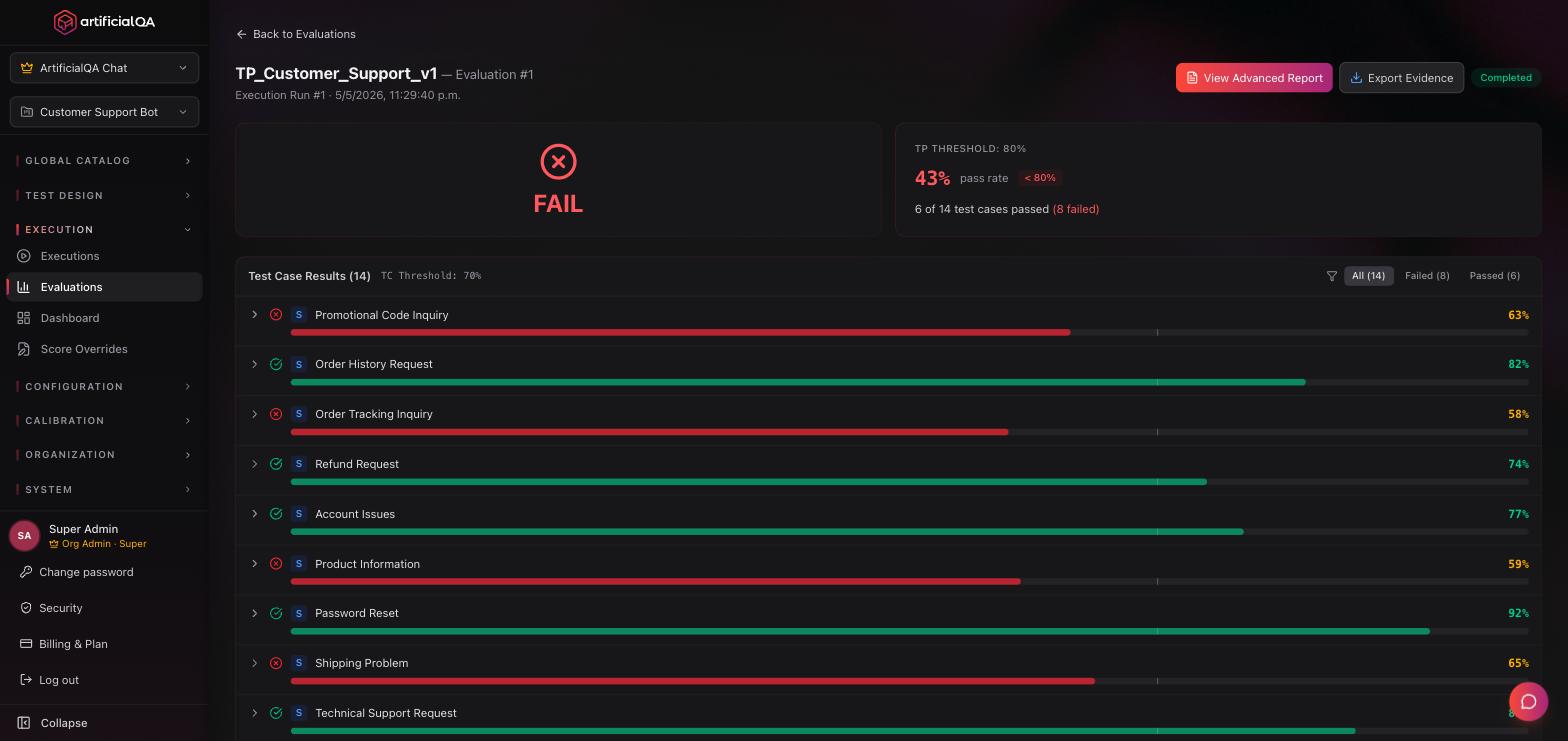
What it shows
- Overall score: weighted average across all evaluators.
- Pass rate: % of cases that passed all hard asserts.
- Performance per evaluator: each activated evaluator with its average score and deviation.
- Detail per test case: for each case, the input, the bot's response, the asserts, and each evaluator's scores with textual justification.
- Failed cases highlighted: the ones that need human review.
Export to PDF
PDF Report button at the top. Generates a PDF with:
- Executive summary (with your organization's header).
- Overall score and pass rate.
- Per-evaluator performance (bar chart).
- Failed case detail.
- Run metadata: date, agent, suite, activated evaluators.
The PDF is meant to circulate within the team or as a deliverable for stakeholders.
AI-powered enhanced report (Enterprise)
Enterprise plan only. On top of the Evaluation Report, the platform adds automatic AI analysis:
- Executive summary in text covering the whole run (3–5 paragraphs), with conclusions, main findings, and recommendations.
- Per-evaluator analysis: for each activated evaluator, a textual explanation of what patterns were observed, what's working well, what to review.
- In Spanish or English depending on configuration.
The enhanced report attaches to the standard PDF.
Trends and run comparison
The dashboard shows the evolution of overall score across runs. This lets you see whether quality is improving, holding, or degrading between releases.
Each individual run can be inspected and exported.
Immutable snapshots and reproducibility
The system keeps two levels of immutable "snapshots":
- Each Run stores a snapshot of the responses the AI agent gave at that moment (input, response, timings, logs). Once executed, that run is never modified again.
- Each Evaluation stores a snapshot of the scores and justifications the evaluators produced at that moment. Once evaluated, that evaluation is also never modified.
This means a report generated 6 months ago looks identical today, even if you changed Test Cases, the AI agent, or the evaluators. It's the foundation of auditability.
Reproducibility: don't expect identical results
The snapshot is immutable, but if you re-run the same Test Plan, the AI agent's responses may be different because there's an LLM behind the AI agent, and LLMs aren't deterministic. Same applies to evaluation: if you re-evaluate the same Run, scores may change because there's also an LLM behind each evaluator.
You can run N different evaluations on the same Run over time (with different evaluators activated, or simply to re-score). They're all stored as independent snapshots.
Score Overrides: manual correction with audit trail
If you disagree with the score an evaluator gave for a specific case, you can edit it manually. The platform:
- Flags the result as "modified" (visible in the report that the score was corrected).
- Keeps the original score in history.
- Logs who made the change, when, and the explanatory note.
The full list of overrides applied in your organization is at Execution → Score Overrides. This keeps full auditability: modifications exist but they're traced.
How to read a score
Evaluators return values between 0 and 1 internally, but the platform shows them on screen as a percentage (0–100%) for easier reading. General guideline:
- 90–100%: excellent. The response fully meets the evaluated dimension.
- 70–90%: acceptable. Meets expectations with minor observations.
- 50–70%: doubtful. Clear problems but not blocking.
- 0–50%: failure. The response doesn't meet expectations on that dimension.
The pass/fail threshold is configurable per evaluator at Configuration → Evaluators/Judges. Each evaluator ships with a sensible default threshold that you can tune to your needs.
Sharing a report
Two ways:
- PDF: export the report and send it by email or Slack.
- API (Enterprise): consume the results from your pipeline.
Members of your organization can also open any run directly by URL — just copy it from your browser's address bar and send it; the recipient needs to be logged in and a member of the same organization to see it. There's no dedicated "Share" button today.
Next step
If you want to see how to connect ArtificialQA with other tools (CI, ticket trackers, notifications), check the Integrations section.